
Precision financial terminal

Financial intelligence. Built like a terminal.

A free, command-driven financial workspace for serious retail investors and finance students. Real-time prices, deep fundamentals, AI analysis and a global macro view. Open data, no subscription.

What is QSTMarkets?

What is QSTMarkets?

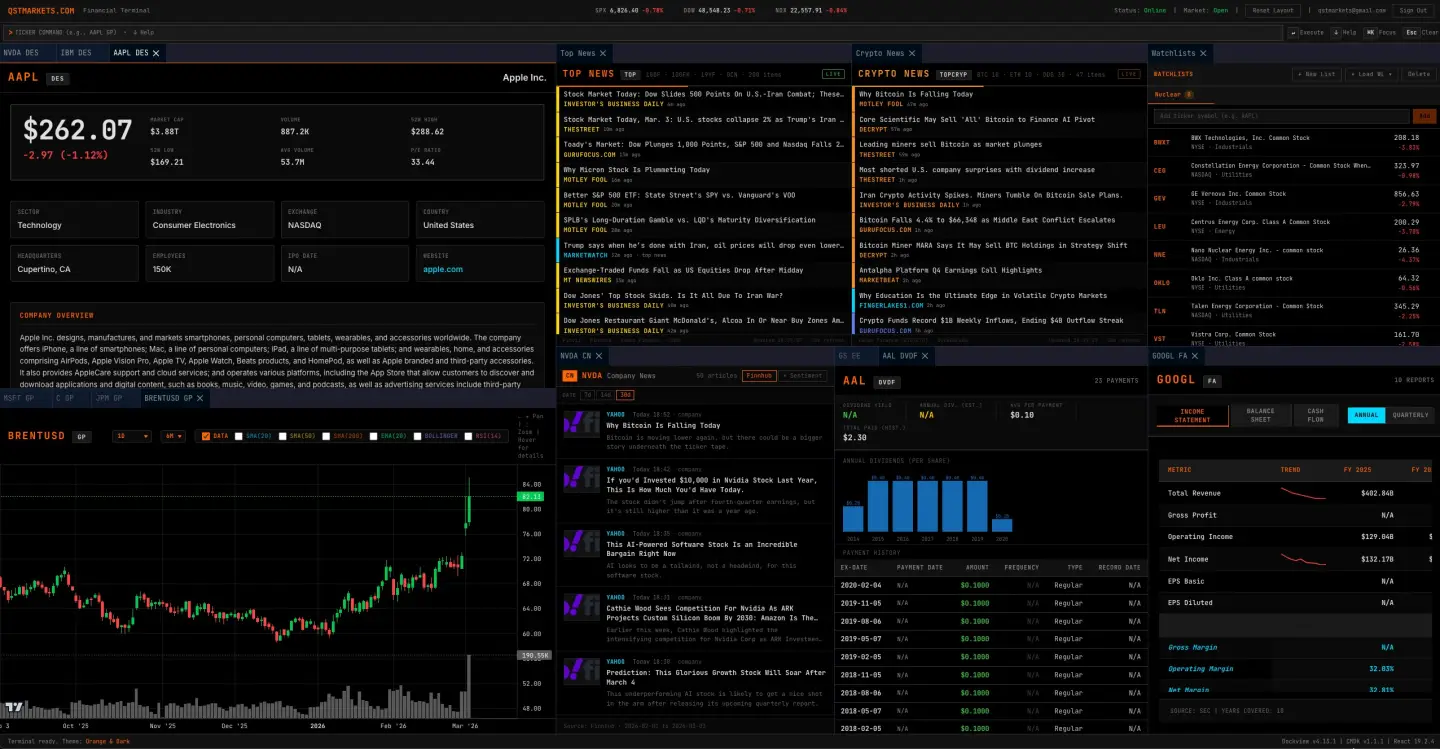
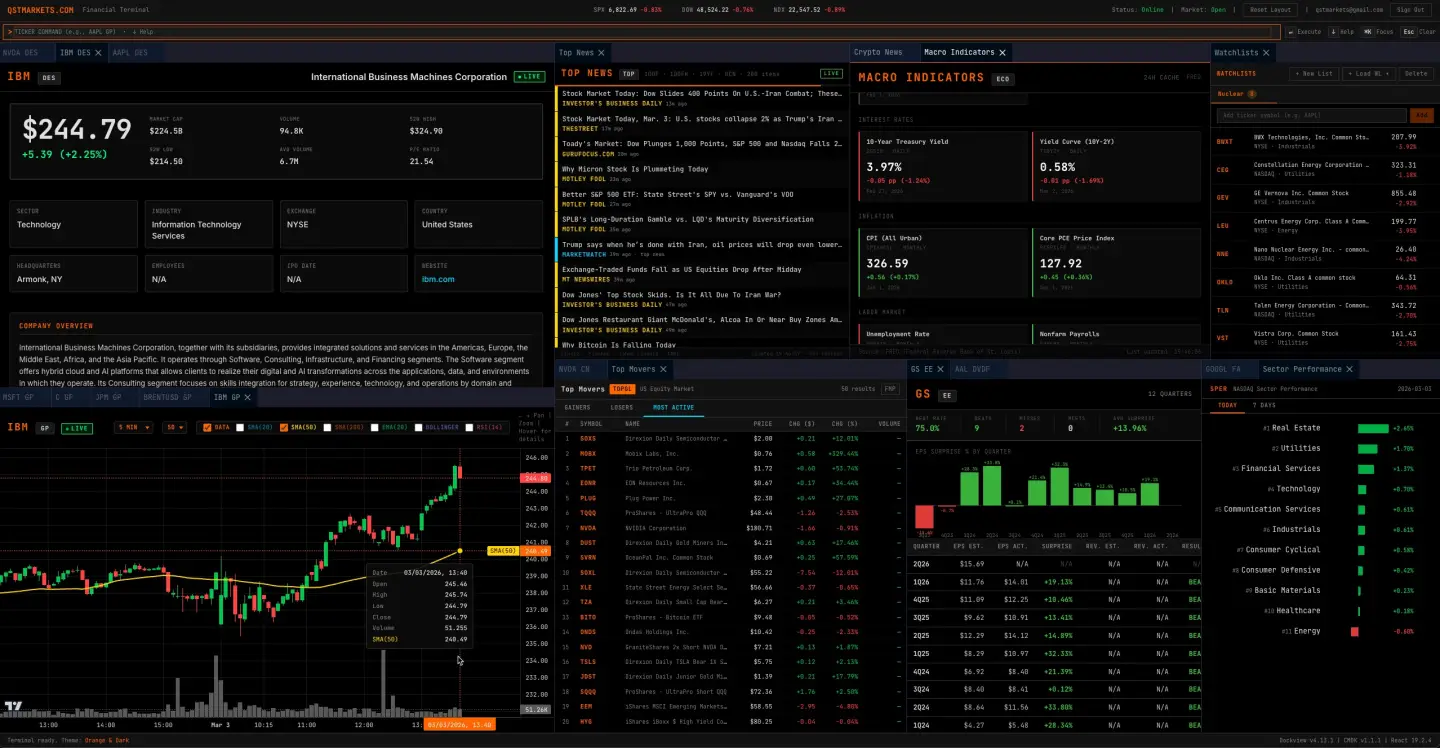
For people who want more than a price chart.

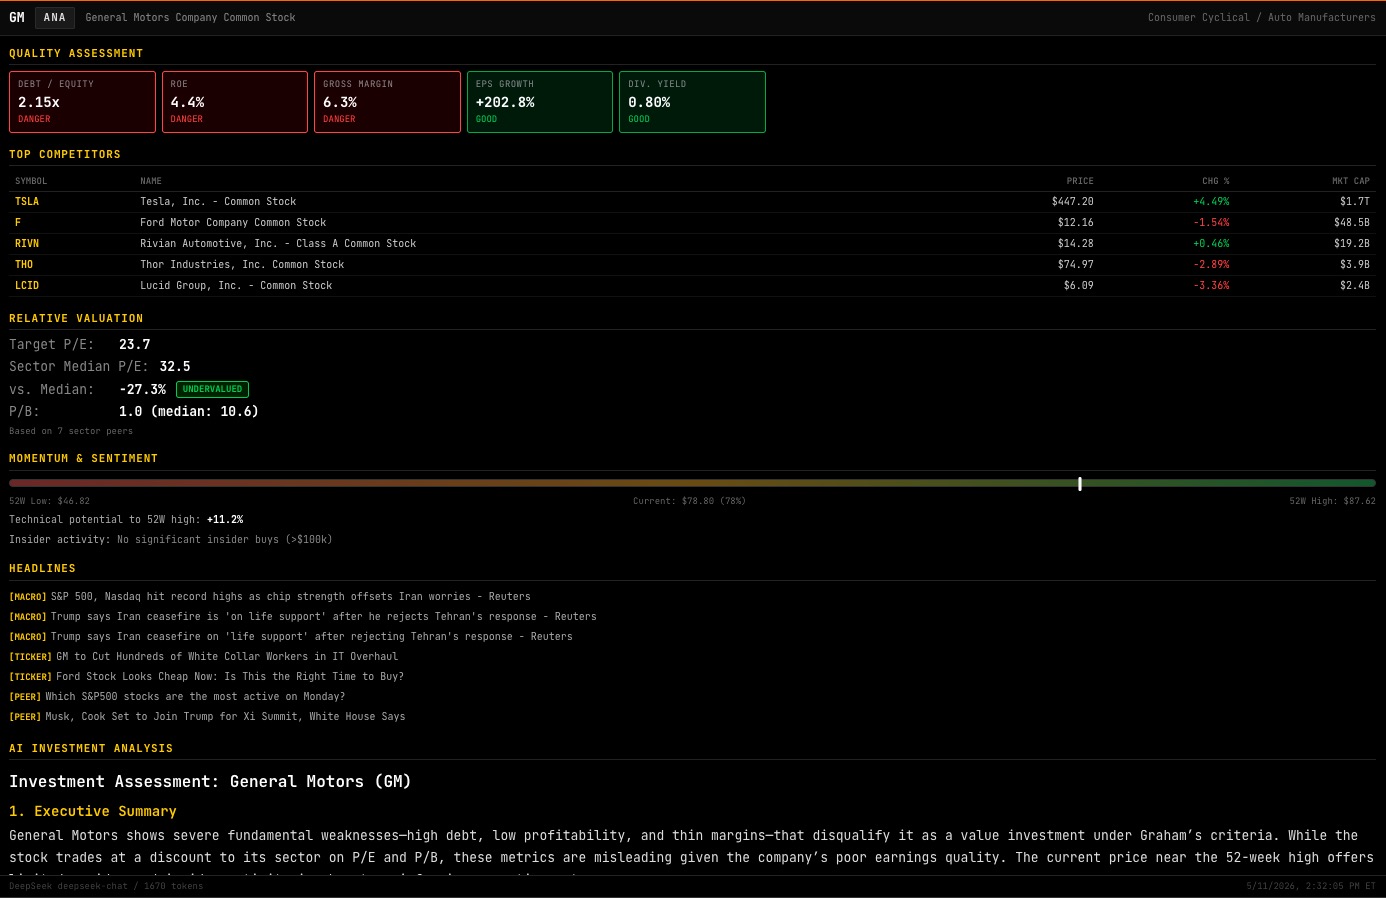
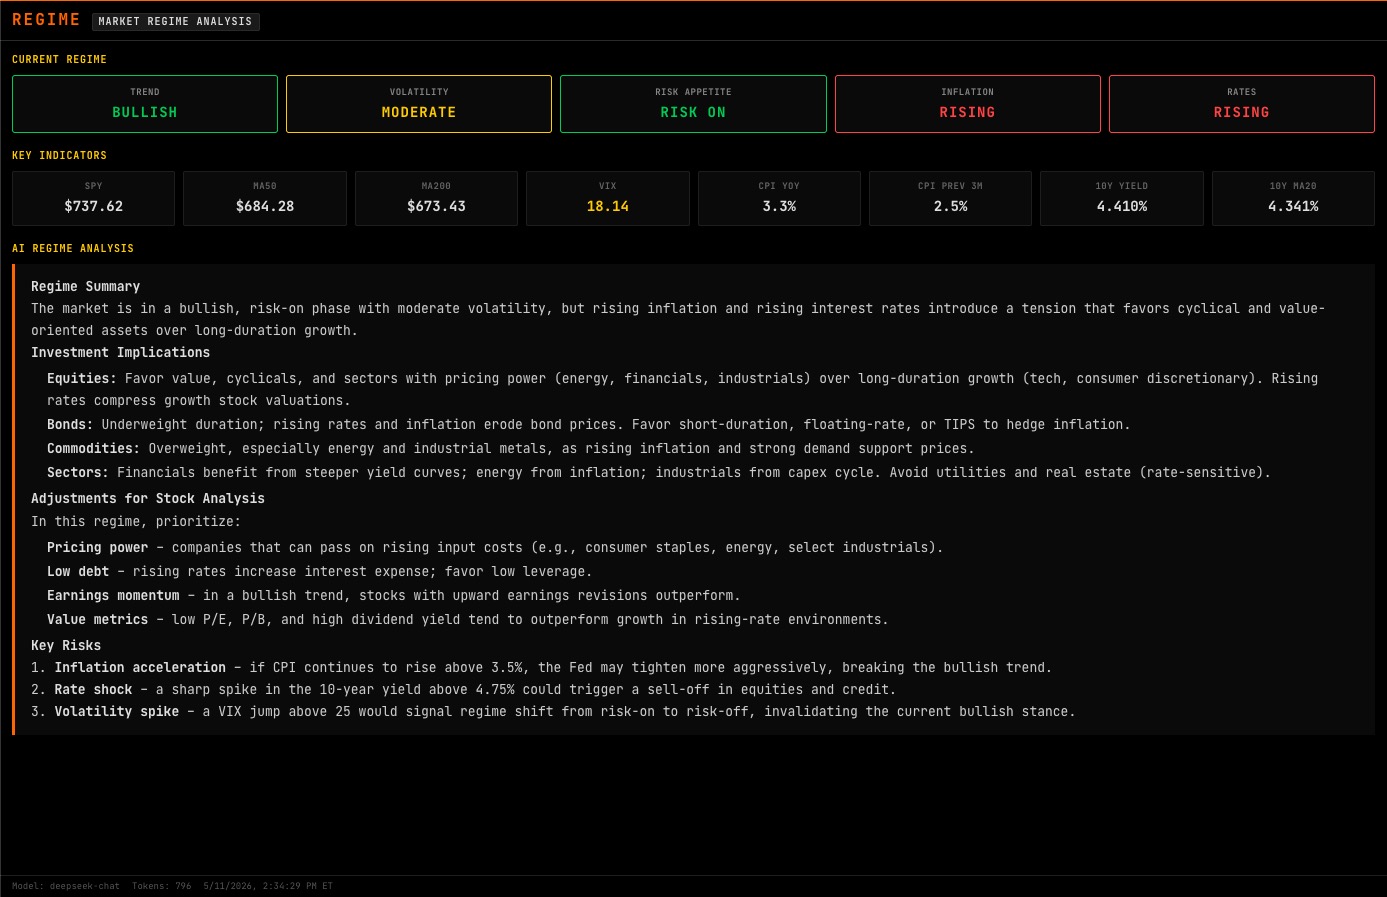
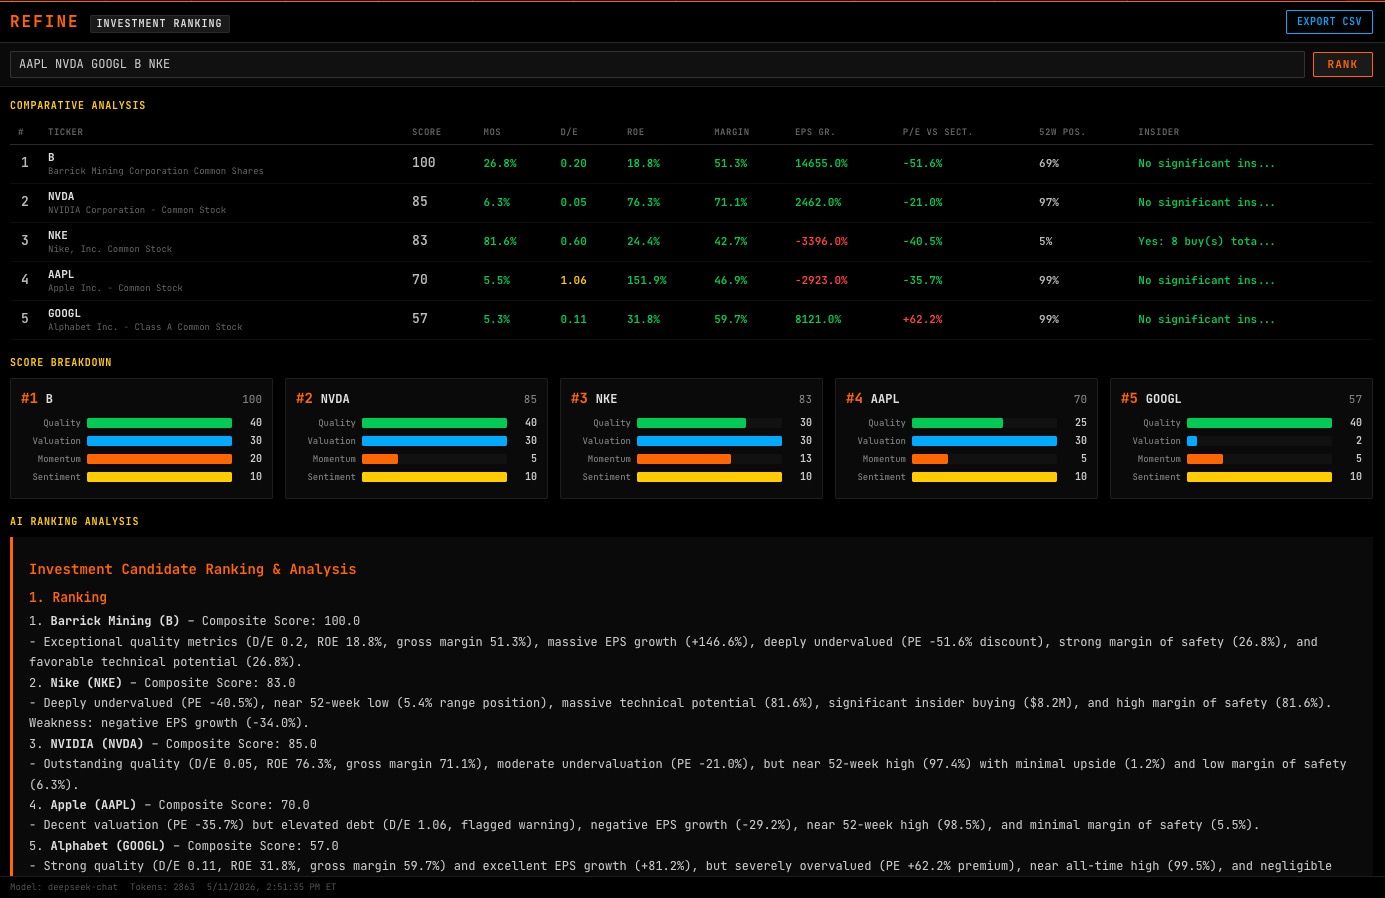
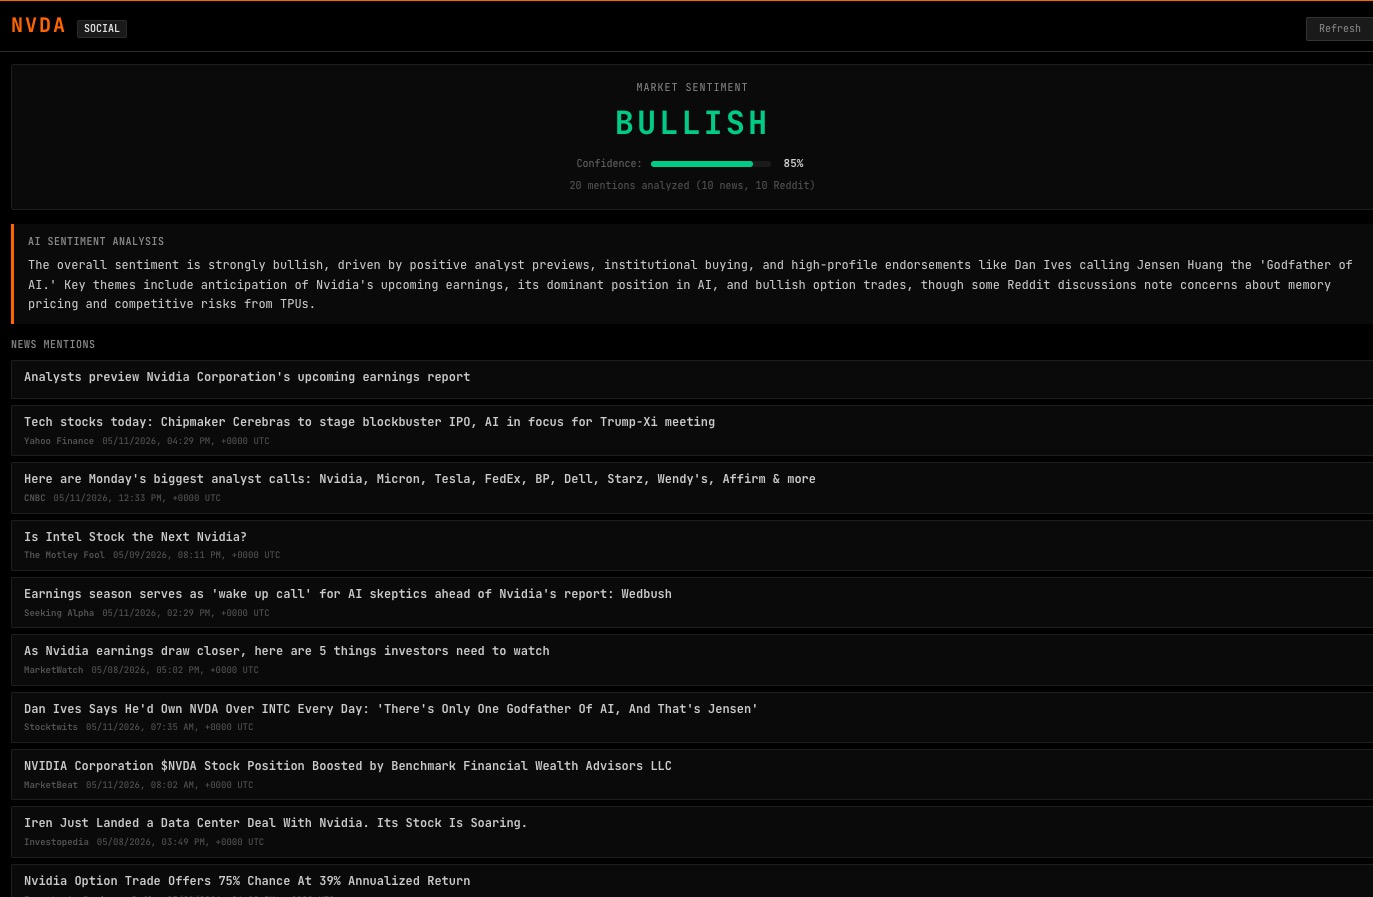
Retail investors who research before clicking buy. Finance students who want to feel the workflow of a real terminal. Analysts and professionals looking for a fast secondary tool. If you only need a price quote, your broker app is enough. If you need context, fundamentals, macro and AI synthesis in one place, that is QSTMarkets.

One workspace instead of fifteen tabs.

Command bar, multi-panel layout that you arrange yourself, persistent across sessions. Type a ticker and a command (AAPL GP, AAPL ANA, BTCUSD GP) and the data lands in the panel you have focused. No menu hunting, no copy-paste between sites.

Open data, not closed feeds.

Every dataset is public or freely accessible. Every panel shows its source and timestamp. When data is an approximation, the panel says so. No subscription, no premium tier, no upsell.

How the workspace works

Type a command. Get a panel. Build your workspace.

QSTMarkets is keyboard-first. Every feature has a short mnemonic. Every command opens a panel. You arrange them as you like.

  1. 1
    Command Bar. Press / or click the bar at the top. Type AAPL GP to open Apple's price chart. Type HELP to browse every command available.
  2. 2
    Panel focus. The active panel shows an orange top border. New commands open inside the focused panel. Click any other panel to switch focus.
  3. 3
    Persistent layouts. Your workspace is saved per account. Close the browser, come back tomorrow, your panels and watchlists are exactly where you left them.

Core capabilities

80+ commands across 10 categories.

Real-time charts and comparisons

Streaming candlesticks, multi-asset comparisons, ten years of OHLCV history.

GP

AAPL price chart with candlesticks and moving averages

Real-time charts

Candlestick with intraday to monthly. Live WebSocket price.

COMPARE

COMPARE command showing AAPL vs PLTR normalized price comparison

Multi-asset comparison

Normalized comparison for equities, crypto and metals.

Fundamentals straight from the source

SEC EDGAR XBRL filings parsed into clean panels. No middlemen.

DES

DES command showing Apple company profile with executives and key metrics

Company profiles

Full description, executives, key metrics for any US equity.

FA

FA command showing AAPL income statement and balance sheet from SEC

Fundamentals

Income, balance sheet, cash flow with multi-year SEC context.

RV

RV command with AAPL valuation multiples compared to sector peers

Relative valuation

P/E, P/B, EV/EBIT vs closest sector peers by market cap.

EE

EE command showing GOOGL quarterly earnings surprises and analyst estimates

Earnings estimates

Quarterly EPS beats, misses, and surprises.

DVDF

DVDF command showing BAC dividend payment history and annual yield

Dividend history

Past payments, annual trends, and yield summaries.

REC

REC command showing DVN analyst ratings and price target distribution

Analyst recommendations

Wall Street ratings, target prices, distribution history.

INS

INS command showing JNJ insider transactions from SEC filings

Insider activity

Executive stock buys and sales from SEC filings.

Curated news, by ticker and by theme

Company news, top movers, crypto, energy and regional macro headlines.

CN

CN command showing NVDA news feed with sentiment indicators

Company news

Per-ticker news feed with sentiment from Finnhub.

TOP

TOP command showing real-time financial market headlines

Top news

Real-time headlines from major financial sources.

TOPCRYP

TOPCRYP command showing aggregated cryptocurrency news headlines

Top crypto news

Aggregated crypto headlines and sentiment.

TOPENE

TOPENE command showing oil, gas and energy sector news

Top energy news

Oil, gas and energy market headlines.

TOPMET

TOPMET command showing precious and industrial metals news

Top metals news

Precious and industrial metals headlines, curated.

TOPREG

TOPREG command showing regional macroeconomic news by geography

Regional macro news

Macroeconomic news by region.

Markets at a glance

World indices, sector rotation, options chains, screeners, heatmaps and shorting flow.

WEI

WEI command showing world equity indices with intraday returns

World indices

Major global indices with intraday performance.

SPER

SPER command showing US sector performance ranked by daily and YTD returns

Sector performance

US sectors ranked by daily and YTD returns.

ECO

ECO command showing live macroeconomic indicators across major economies

Economic indicators

Live macro indicators across the major economies.

ECOCAL

ECOCAL command showing economic calendar with impact levels for US, EU, UK

Economic calendar

US, EU, UK, Germany, Japan. Impact level. Forward-looking.

HEAT

HEAT command showing heatmap of top 500 US equities by daily performance

Market heatmap

Top 500 US equities by market cap, colored by daily performance.

OMON

OMON command showing NVDA options chain with Greeks and open interest

Options monitor

Full options chain with Greeks, IV, volume, and open interest.

SCAN

SCAN command with equity screener filters for sector, market cap and volume

Equity screener

Filter US equities by sector, market cap, price and volume.

SHORT

SHORT command showing most shorted US stocks ranked by short float percentage

Most shorted stocks

Top US stocks ranked by short % of float with days to cover.

WB

WB command showing sovereign bond yields across major global issuers

World bonds

Sovereign yields and bond performance across major issuers.

Also: COMM (agricultural commodities), FEDW (Fed funds tracker), TOPGL (top movers).

Watchlists, factor exposure and risk

Build watchlists, run factor regressions, check correlations and stress your VaR.

WL

WL command showing personal watchlist with tickers synced across sessions

Watchlists

Personal ticker groups, synced across devices.

CORR

CORR command showing pairwise correlation matrix with rolling window

Correlation matrix

Pairwise correlations with rolling temporal view.

FACTOR

FACTOR command showing portfolio factor exposure to market, value and momentum

Factor exposure

Beta and R-squared to market, value, growth, size, momentum.

RISK

RISK command showing VaR, CVaR and per-asset risk contribution

Portfolio risk

VaR, CVaR, and risk contribution per asset with return histogram.

BACKTEST

BACKTEST command showing SMA crossover strategy equity curve vs buy and hold

Strategy backtesting

Test SMA crossover or RSI strategies vs buy and hold.

PERF

PERF command showing portfolio cumulative return, alpha, beta and Sharpe ratio

Portfolio performance

Cumulative return, alpha, beta, Sharpe and contribution by position.

AI you can trace back to data

Every AI output is grounded in current market data and the active macro regime.

QSTA

QSTA command showing AI-generated daily market briefing by DeepSeek

AI market analysis

Daily briefing by DeepSeek, pre-open, mid-session, recap.

ANA

ANA command showing AI investment analysis with BUY/HOLD/AVOID verdict

AI investment analysis

Quality, valuation, momentum, sentiment and BUY/HOLD/AVOID verdict.

REGIME

REGIME command showing market regime classification across five macro dimensions

Market regime

Trend, volatility, risk appetite, inflation, rates: the macro context.

REFINE

REFINE command showing AI composite score and ranking for a list of tickers

AI stock ranking

Score and rank a list of tickers with composite scoring and AI rationale.

SOCIAL

SOCIAL command showing AI sentiment from news and Reddit as bullish or bearish

Social sentiment

AI sentiment from news and Reddit mentions, bullish/bearish/neutral.

Global macro coverage

Inflation, central banks, growth, employment, trade, housing and FX across 60+ countries.

INFL

INFL command showing world inflation heatmap with CPI breakdown by country

Global inflation

World CPI heatmap with core, headline and real-rate breakdown.

RATES

RATES command showing sovereign yield curves for US, EU and other major issuers

Sovereign yield curves

Real-time yield curves for major sovereigns.

CB

CB command showing central bank policy rates, decisions and FOMC calendar

Central banks

Policy rates, decisions, calendars and minutes.

NFP

NFP command showing non-farm payrolls with sector breakdown and market reaction

US labor report

Non-farm payrolls release with sector breakdown and market reaction.

PMI

PMI command showing manufacturing and services PMIs across global economies

Purchasing managers worldwide

Manufacturing and services PMIs across developed and emerging economies.

FXRATES

FXRATES command showing major FX pairs, EM currencies and DXY dollar index

FX pairs and dollar strength

Majors, EM currencies, DXY and volatility complex.

And the rest of the module: GDP, EMPLOY, TRADE, HOUSING, RATEPATH, INFEXP, WEO, CONFIDENCE.

Credit markets and derivatives

The dimension of analysis most retail terminals ignore.

CREDIT

CREDIT command showing investment grade and high yield OAS spreads with percentiles

OAS spreads dashboard

Investment grade, high yield and per-rating OAS with historical percentiles.

STRESS

STRESS command showing financial stress index across credit, equity and rates

Financial stress index

Composite index of systemic stress across credit, equity and rates.

CRCYCL

CRCYCL command showing credit cycle phase classification

Credit cycle phase

Classifier across early expansion, late expansion, deterioration, recession.

BDCMON

BDCMON command showing Business Development Companies performance snapshot

BDC monitor

Business Development Companies snapshot for private credit exposure.

CDSEVT

CDSEVT command showing ISDA credit event timeline with recovery rates

Credit event timeline

ISDA Determinations Committee decisions, auctions and recovery rates.

SOVCDS

SOVCDS command showing world map of sovereign credit default swap spreads

Sovereign CDS heatmap

World map of sovereign CDS spreads.

Also in the module: CDX, PRIVCR, DEFAULT, DTCCTOP, CDSBASIS and SWAPSP.

Weather and commodities

Weather data integrated with agricultural, energy, metals and carbon markets.

WMAP

WMAP command showing global weather map with commodity-region overlays

World weather map

Interactive global map with weather overlays over commodity-critical regions and 14-day forecasts.

WFORECAST

WFORECAST command showing 15-day hourly weather forecast with AI commodity interpretation

Commodity weather forecast

15-day hourly forecast for any region, with AI interpretation in commodity terms.

DROUGHT

DROUGHT command showing SPI drought index map for agricultural regions

Global drought monitor

SPI drought index for agricultural zones, with timeline and exposed commodities ranking.

AGRI

AGRI command showing agricultural commodities dashboard with USDA crop conditions

Agricultural commodities

Corn, wheat, soybeans, cotton, coffee and sugar, with USDA crop conditions and weather context.

ENERGY

ENERGY command showing energy commodities with heating and cooling degree days

Energy and weather demand

Natural gas, oil and coal, with heating and cooling degree days from current weather patterns.

CROPZONE

CROPZONE command showing per-crop zone monitor with phenological stage and AI outlook

Crop zone monitor

Per-crop view with phenological stage, USDA condition ratings and AI outlook.

Also in the module: METALS (precious and industrial metals dashboard) and CARBON (emissions allowances and carbon credits tracker).

Swing strategies and paper automation

Daily ranked swing trading candidates, strategy backtester, paper portfolio simulator and a paper-only auto-trading engine. No real capital, no broker connection.

SWING

SWING command showing ranked swing trading candidates with composite score and entry levels

Swing trading scanner

Daily ranked long and short candidates from a Connors RSI(2) mean-reversion model. Composite score, entry, target and stop levels.

PSWING

PSWING command showing paper portfolio simulator with equity curve and performance metrics

Paper portfolio simulator

Track simulated positions, calibrate the strategy on hypothetical equity, never with real capital. Win rate, Sharpe, drawdown and equity curve included.

AUTOTRADER

Beta
AUTOTRADER bot tab inside PSWING showing status, configuration and activity log

Automated paper-trading engine

Built-in paper bot accessible via PSWING > BOT. Evaluates SWING candidates against user-configured filters, sizing models and circuit breakers during the entry window, and opens or closes paper positions when criteria are met. Paper only, never connected to any broker.

SWBT

SWBT command showing swing strategy equity curve and metrics compared to Buy and Hold

Swing strategy backtester

Run rule-based strategies (Connors RSI(2), IBS, RSI threshold, SMA crossover) on any US equity, up to 10 years of OHLCV. Compared against passive Buy & Hold.

SWMET

SWMET command showing SWING model benchmarks table with win rates for SPY, QQQ and IWM

Methodology and benchmarks

Documented signal weights, academic foundations, and historical in-sample benchmark results for the SWING model on SPY, QQQ and IWM.

The AI layer

AI that knows where the market stands.

Every AI panel in QSTMarkets is built around three principles: it reads current data before answering, it knows the active macro regime, and it labels its outputs.

  1. Regime-aware. When you run ANA on a stock or QSTA for a market briefing, the model receives the current REGIME (trend, volatility, risk appetite, inflation, rates) as context. The same stock gets analyzed differently in a risk-on bull regime than in a risk-off contraction.
  2. Structured outputs. Investment Analysis (ANA) returns a BUY/HOLD/AVOID conclusion with entry price range. Stock Ranking (REFINE) returns a 0-100 composite score with sub-scores. Social sentiment (SOCIAL) returns BULLISH/BEARISH/NEUTRAL with confidence. Outputs are designed to be useful, not impressive.
  3. Cached and labeled. Every AI panel shows the model used, token count, timestamp and a CACHED flag if the result was served from Redis. You always know if you are seeing fresh analysis or recent cache.

Powered by DeepSeek. Outputs are not financial advice.

ANA command showing AI investment analysis with quality, valuation and BUY/HOLD/AVOID verdict

Data coverage

Powered by real data.

Multi-asset coverage, freely accessible sources, transparent timestamps.

Asset class Examples Coverage Real-time
US equities AAPL, MSFT, JPM Full: price, fundamentals, news, screener Yes (WebSocket)
Crypto spot BTCUSD, ETHUSD Price, description, news Yes
Precious metals XAUUSD, XAGUSD Price, news Yes
Energy commodities WTIUSD, BRENTUSD Price, news Yes
Global macro INFL, RATES, CB 60+ countries, full dashboards Daily/monthly
Credit markets CREDIT, SOVCDS, BDCMON OAS spreads, sovereign CDS, BDCs, ISDA events Daily
Weather and agriculture WMAP, DROUGHT, CROPZONE Global commodity regions, USDA crop conditions, energy and carbon markets Daily

Data sources

Tradier

Real-time SIP WebSocket + REST quotes

Tiingo IEX

Intraday bars

SEC EDGAR

Fundamentals (XBRL)

FRED

Macro indicators and credit spreads

Finnhub

News and sentiment

DeepSeek

AI analysis

Binance (CCXT)

Crypto spot price

Nasdaq

Economic calendar

BLS

US labor and inflation data

OECD

Cross-country macro indicators

IMF

World Economic Outlook forecasts

World Bank

Long-history macro data

BIS

REER and policy rates

DTCC

CDS public reports

ISDA

Credit derivatives determinations

Open-Meteo

Weather forecasts and historical reanalysis

USDA NASS

Crop conditions and progress

USDA FAS

World production, supply and distribution data

NOAA

US weather and climate data

EIA

Energy data and indicators

Ember Climate

EU ETS and carbon market data

Transparency

Every panel tells you where its data comes from.

A serious analysis tool needs to be honest about its sources. Every panel in QSTMarkets shows the data source, the as-of timestamp and, when applicable, a flag indicating that a value is an approximation rather than a direct feed. We use public APIs (FRED, SEC EDGAR, BLS, OECD, World Bank), freemium APIs (Finnhub, Tiingo) and our own ETL pipelines, never undisclosed data brokers.

If we cannot get a true real-time feed (for example, single-name CDS spreads), we say so and explain the proxy we use. No magic, no hidden fees, no fake institutional data.

Built in the open

Four advanced modules went live recently.

QSTMarkets is developed iteratively, in public, with a clear bias toward open data sources. Together, these four modules add 39 commands to the workspace, all built on public data and all following the same source-tagging principle.

Macro module

Live

60+ developed and emerging economies. Inflation, rates, central banks, growth, employment, trade, housing and FX.

  • INFL
  • RATES
  • CB
  • GDP
  • EMPLOY
  • NFP
  • PMI
  • TRADE
  • HOUSING
  • RATEPATH
  • FXRATES
  • INFEXP
  • WEO
  • CONFIDENCE

Credit derivatives module

Live

The dimension of analysis most retail terminals ignore. OAS spreads, sovereign CDS, credit events, stress index and cycle classification.

  • CREDIT
  • STRESS
  • BDCMON
  • CRCYCL
  • DEFAULT
  • CDSEVT
  • DTCCTOP
  • CDX
  • SOVCDS
  • PRIVCR
  • CDSBASIS
  • SWAPSP

Weather and commodities module

Live

Weather data integrated with agricultural and energy commodity dashboards. Built with input from professional commodity and energy analysts contributing on a voluntary basis.

  • WMAP
  • WFORECAST
  • DROUGHT
  • AGRI
  • METALS
  • ENERGY
  • CARBON
  • CROPZONE

Swing strategies and paper automation module

Live Bot in beta

Quantitative swing trading from scanner to simulation. Daily ranked candidates, full backtester against Buy & Hold, paper portfolio with realistic slippage and buying-power accounting, and an autonomous engine that evaluates candidates and manages paper positions according to user-configured filters when criteria are met. Paper only, never connected to any broker.

  • SWING
  • PSWING
  • SWBT
  • SWMET
  • AUTOTRADER

Before your first session

Read the manual before opening the terminal.

QSTMarkets is command-driven. With more than 80 commands across ten categories, the difference between landing in the terminal cold and landing after a 30-minute read is enormous. The manual covers every command with screenshots, data sources and tips. We strongly recommend skimming it before opening the terminal for the first time.

Send us a message.

Questions, feature requests or sponsorship inquiries. We will reply with a reference code.